
Before we get to the Impact Report, we’d like to share our gratitude for the cooperation that made these results possible: Together, we collected responses from 128 co-ops, which represents 76% of our membership! Thanks to your willingness to participate in this annual survey, we can discern a more accurate picture of our combined social and environmental impact.
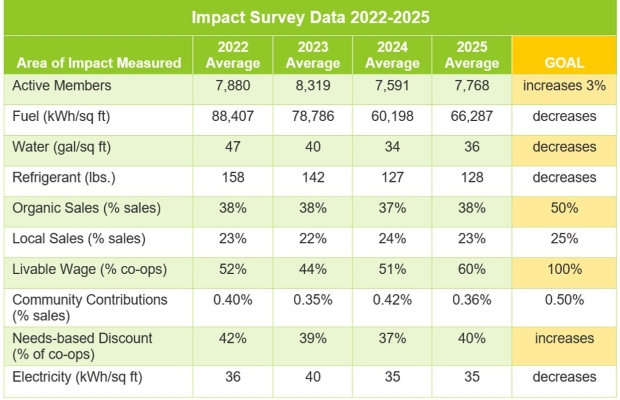
While the 2025 Food Co-op Impact Report shares some of the impact data co-ops reported on this year, it doesn’t provide a complete picture of year-over-year survey results and emerging trends.* In the chart above, you can see how some of the survey questions stack up over the past several years compared to goals we have set for our community of co-ops as a whole.
How Did We Do?
We met our goal for the percentage of co-ops offering Needs-Based Discounts in 2025, which was one of two areas we had noticed last year as a difficult area to improve upon based on three-year trends. Although we didn’t meet our other benchmark goals in 2025, looking at trendlines for the data across three years, we are headed in the right direction in many areas:
- Co-ops had an increased average number of Active Members in 2025, moving toward our goal by 2%. This was identified as an area for growth in 2024, and co-ops made great progress!
- The number of co-ops reporting that they offer all employees a Livable Wage increased by 10% over the last year, bringing us to 60% of co-ops reporting that they pay 100% of staff a livable wage or according to their union contract. This number has increased every year over the past three years and shows a clear trend toward our goal. Interested in learning more about this topic? NCG offers support and resources in the Co-op Livable Wage and Benefits Model.
- Organic Sales have remained pretty consistent over the past three years, with an increase of 1% between 2024 and 2025. In 2025, 38% of NCG co-ops’ annual sales came from organic products. Compared to conventional stores where just 3% of sales were from organic products and natural retailers at 24% of sales, the NCG system is a high performer on average.
- Community Contributions decreased by .05% of total sales between 2024 and 2025. However, looking at the three-year trend, this metric is trending upward overall.
- Fuel Use Intensity is an area for continued focus. Co-ops made progress in 2024, decreasing fuel consumption by 10%. In 2025, this number increased by 10%, meaning in the short-term we did not meet our goal. However, since the 2022 benchmark year (in which we established our baseline for calculating fuel use), our collective Fuel Use Intensity is still decreasing overall and moving toward our goal.
- Similarly, Water Use Intensity also increased in the past year. While we did not meet our short-term goal, looking at trends since we established a baseline in 2022, we are trending toward decreased water use per square foot.
- Refrigerant Gas Use has trended down since 2021. However, similar to Fuel and Water Use Intensity, the amount of refrigerant gas recharged in 2025 increased from 2024. It was up by 1 pound on average and is an area to remain focused on. Refrigerant gases are some of the most harmful to our atmosphere and focused attention on decreasing them is among the most important things grocers can do to slow climate change.
- Electricity Use Intensity stayed consistent over the past year and has shown a consistent trend of decreasing since the benchmark year of 2022, when we began tracking resource use per square foot. Co-ops can access resources to reduce electricity usage on the NCG website.
- Local Sales trended down slightly this year, with 23% of sales coming from local products. Over three years, trends have remained neutral, although the average co-op worked with 187 Local Producers in 2025, which is up by 12 producers from 2024. NCG co-ops performed well ahead of the average food retailer operating less than 10 stores, which reported partnering with 41 local farms, according to 2023 data from FMI. FMI data also reported that for conventional grocers, local products make up about 2% of total sales.
Gratitude, Collaboration and Inspiration to Keep Going
None of these findings would be possible without your participation. Thank you for your contributions to this effort!
Co-op staff who work on the Impact Survey or have sustainability-related responsibilities are invited to join me on bimonthly sustainability staff catch-up calls, provided that they have approval to do so during working hours. We meet on the first and third Tuesdays of every month to collaborate, build community and encourage each other to make the changes in our stores that make a difference to our communities and the world. Find dates and times listed on the NCG Events page of our website.
*NCG reports to our board of directors and co-op designated representatives (DRs) on all metrics annually in the annual NCG Ends Report. Additionally, Co+efficient users can use the dashboards feature to analyze their co-op’s year-over-year progress and compare progress with their peers.